Is it already a year since I last jotted
down my day?
WWDS2006 started the
same way as most for me. A ride to work on the trusty
deadly treadly - though this morning it was somewhat untusty;
I copped a flatty that had quietly gone down overnight.
Bugger. Grab the other bike and
a nice cruise into work along Port Phillip bay. Its a chance to clear the
mind and get some quality thinking time in. Cos let face
it, thinking is pretty much what we’re paid to do.
A
shower in the basement (thanks
Bureau folks) and then up to the desk. As per
usual the day starts with a chat to the
boss. This time it’s less of a chat and more of a
formal debrief, as he’s been overseas the past 10 days
and hence I’d been the acting head of the Climate Analysis Section while he was
away. We chat for over an hour about all the coming and
goings and rough and tumbles of the past week in the climate
world, and just short of the reaching the Grand
Unified Theory of the Universe, we break to do some
real work.
9:45am
– Onto the email. What would we do without email?? Probably
a lot more work… I’ve taken to switching off the email
altogether whenever I need to get real work done. This
time I’m happy to read it though, as my wife has sent
me some emails from Perth,
where she is visiting this week as part of the Indian
Ocean Climate Initiative, a big and important study
funded by the W.A gummint to try and determine why southwest
W.A has dried out over the past 30 years. And
more importantly, if the rain will ever come back.
Another email that comes
in is from RealClimate. Realclimate is a blog by climate scientists
on climate change, and really is one of the best sources
for info on the latest findings in the climate field.
This time they have posted and article on “Lessons
from Venus”– put simply, Venus
is very similar to Earth in many respects, but the main
difference is that it has a “super greenhouse”, where
the gasses are in such high concentrations that an incredible
amount of the suns radiation is trapped, making the planet,
literally, boil. You think last
year (2005) was hot in Australia; that’s nuffin. For
Venus that would be an ice age.
Its 10am
and time to arrange our weekly meeting for a new project
we’re working on - a new Bureau web
page for agriculture and agribusiness. We’re going
to have a groovy new rainfall forecast web page, using
a selection of models to make pure objective forecasts,
and also provide probabilities on how likely it will be
that rain will fall. In research form it’s called the
“poor
man’s ensemble”. So as not to insult men, women or
the poor, we’re just calling it a rainfall forecast.
10:10am
-- Blair, our resident stats guru (as well as being an
orienteering champion and whose dad runs the Australian
Bureau of Statistics – stats are obviously a genetic
trait) hands me a paper to review on Australian climate
extremes. I’ll have to do this later today. Understanding
climate extremes is vital to us understanding one of the
big impacts of climate change. Subtle changes in temperature
go largely unnoticed, but things like more hot days and
fewer frost events have a significant impact on people
and industry. Blair has analysed climate extremes in all
the states and territories. Past measurement practices
have lead to some unfortunately dodgy records – even Australia’s
hottest temperature on record looks very suspect,
due in no small part to it being measured inside a beer
crate! (“But it was so hot my grandad saw birds falling
out of trees...”)
Another paper arrives
for me to look at – this time one published on the impact
of climate change on seasonal forecasts. Seems that increasing ocean temperatures are making it easier and
easier to forecast land temperatures, as in general a
warmer Pacific Ocean gives us warmer
temperatures – something we have noticed too. In
fact the ABC once told us they aren’t all that interested
in our long range temperature
outlooks as “they always say it’ll be hotter than
average – and everyone knows that”…
One of the other jobs
I do is look after some data called “OLR”. OLR is short
for Outgoing
Longwave Radiation, and is a measure of the suns (shortwave)
energy that, after being absorbed by the ground, trees,
air particles etc, is re-emitted into space as longwave
energy. As clouds, especially in the tropics, have very
cold temperatures at their top they emit only a small
amount of radiation. We can “see” these clouds quite easily
from space. More cloud in the tropics near the dateline
can warn us of El Nino events. Today I make some quick
changes to the script to read in the OLR data from our
friends at NOAA – the atmosphere and ocean agency in the USA.
More info to soak in,
though this one is more of a personal interest; read a
media release from
our minister on a new ice runway to be built in the Antarctic.
Flights will commence from Australia
to Antarctica in 2007. Back when
I was a young Watto, my honours project was looking at
how we could use better information on sea ice from satellites
to improve weather forecasts round Antarctica, and hence
make flying there just that lil bit safer.
Ahh… if that’s chocky
it must be 10:40. A Climate Analysis
tradition is if you travel overseas for work you bring
back Chocky. You’re supposed to find some local choc.
Dave has cheated. He’s bought something from Melbourne
airport in a last minute panic! (But chocky is chocky…
)
A
quick check of my wave maps.
As a side project I run a web page at The
University of Melbourne that maps and graphs weather around Melbourne.
I’ve just put up some maps of the waves…
Ok, finally (at 11:00am)
onto the real work for the day. Every few months we’re
required to write up summaries of what, when, where, how
and why the climate has behaved as it did during the seasons
of the year. These are published in the journal “Australian Meteorological Magazine”. This
time I’m co-authoring a seasonal summary paper with Xiangdong
(William) Wang. William’s handed me the first draft and
I’m adding my 2c worth to the paper, as you do as a second
author. Luckily we’re discussing winter 2005 in the southern
hemisphere, which wasn’t a highly spectacular or controversial
season, so this one is pretty straight forward. But as
per usual, it needs concentration. So… I slink off to the library and
hide away with a laptop and my notes. Ahh… bliss: no distractions.
But I can see the bay and yachts and clouds and the outside
world… a minor distraction.
12:40
– wander back to the desk and grab the lunch crew. We
wander off to the Telstra Dome (home of the $5 foccacia;
and you thought it was all about the footy).
1:40,
back from lunch. Arghh…more email!
Time
to review the words for the “ENSO Wrap Up”. Every couple
of weeks our section writes a commentary on the current
status of El Niño/La Niña. One of my colleagues
has written it this time, but I need to read over it and
offer comment so we tell a consistent story. Looks good
and only have a few minor comments. El
Niño, and for that matter La Niña, are vitally
important climate drivers for Australia.
They have major
impacts for Australian rainfall and to a lesser degree,
temperature. And this translates to good or bad times
for Australian agriculture. Our last, relatively weak,
El
Niño cost Australia hundreds of millions of dollars.
Its big bikkies. Right now things
are a little cool and some say edging towards La
Niña, but there’s some signs (and computer models)
which suggest the climate is at its peak, and the situation
will ease towards normal. A bad sign
for those farmers hoping for a good rainfall year after
so many bad ones.
2:00
pm – time for our Land
and Water meeting. Currently we run a set of web pages
aimed at the rural sector – called SILO – but SILO is getting a little long in the tooth
and we’ve got a swag of new products
we’d love to get out there. So as part of this we are
making a new set of web pages – called Land & Water.
It will probably be launched by our Parliamentary Secretary
later in the year.
3:30
– The meeting is over so I bustle down to the
Summit Café to grab a hit choc to go. Mmmm…. hot chockky…
AMOS Bulletin time…
The Australian Meteorological
and Oceanographic Society (AMOS) is the professional
society for Australia’s
weather and ocean scientists. I was the editor of the
society’s Bulletin until recently, but have handed that
role onto someone young, fitter and leaner.. who has a little more time than
me – thank goodness – and I’ve moved to the role of Editor-in-Chief.
Every two months I’m sent a draft of the Bulletin to read,
ponder and offer comments, before the final version gets
flung off to the printers. As this is something that will
be read by some 600 of your peers (many who one day may
just offer you a job!) you can’t be too sloppy…
Ok, job done. Its now
nearly 4pm and that other project for the day – the Seasonal
Climate Summary paper – just wont edit itself. I slink
off to the library for some peace and quite and continue
the slow process that is finalising a paper for publication.
But at least we’re near the end now!
5:05pm.
Review finished! Phew. Back at the desk and momentarily
distracted by the Australia-Banlgadesh
test match… how did people follow sport before the
internet eh?? The final job of the day is to finish off
that review of the extremes paper. Man, has this been
a day for reading stuff or what?
6:15pm
and its time for a final check of the climate. The TOGA-TAO array has got to
be the greatest thing for an operational climatologist
since sliced bread. (Or Google.) The TAO
array is a set of moored buoys in the Pacific
Ocean, strung out along and just either side
of the equator. These amazing jobbies sit there and measure
all sorts of things – but the main ones are the winds
(the Trade Winds)
and the temperatures both above and below the ocean surface.
Wind and the ocean temperatures tell us a lot about how
likely we are to have (or not have) an El Nino or La Nina event.
6:20pm…
time to check the RADAR
for the ride home… should be dry tonight.
Oh blast… more email…
but it alerts me to the fact that some old data I collected
back when I was a Young Watkins (in the dark ages, a.k.a
1995) is now available on
line! Coooool. Back then I was
studying sea ice in
the Antarctic for my PhD. Sea
ice is the ice that freezes from the ocean water,
and floats about on top acting like a giant esky lid –
keeping cold air and warm (if anyone can call -1.8degC
warm) water apart. If you put holes and cracks in the
ice (called “leads”) heat from the ocean escapes and can
modify the air above it. (The other cool thing (scuse
pun) about sea ice is that if you melt it, the sea level
doesn’t change. Try it some time… put an ice cube in a
glass and fill it to the top. Let the ice cube melt… and
it wont overflow…. Trust me.
Its this Archimedes
principle thingy…)
When I was studying sea ice I did part of that study with
computer models, which was pretty dull at times, so I
begged, pleaded and blackmailed until I managed to get
sent to Antarctica. There I observed
the sea
ice first hand, and after all this time the data we
collected is now available for anyone to see. In fact
on
my first trip I did all the observations in the last
week on my own, so you can exactly where and when the
observations started and ended each day, and hence where
we were (and where we traveled) when I got some shut eye!
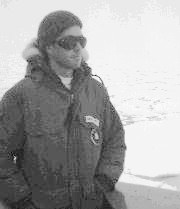
Antarctica
– now that was a world wild daze of science….
Fig.
1
- Coast of East Antarctica &
where I did observations of sea ice in 1994.